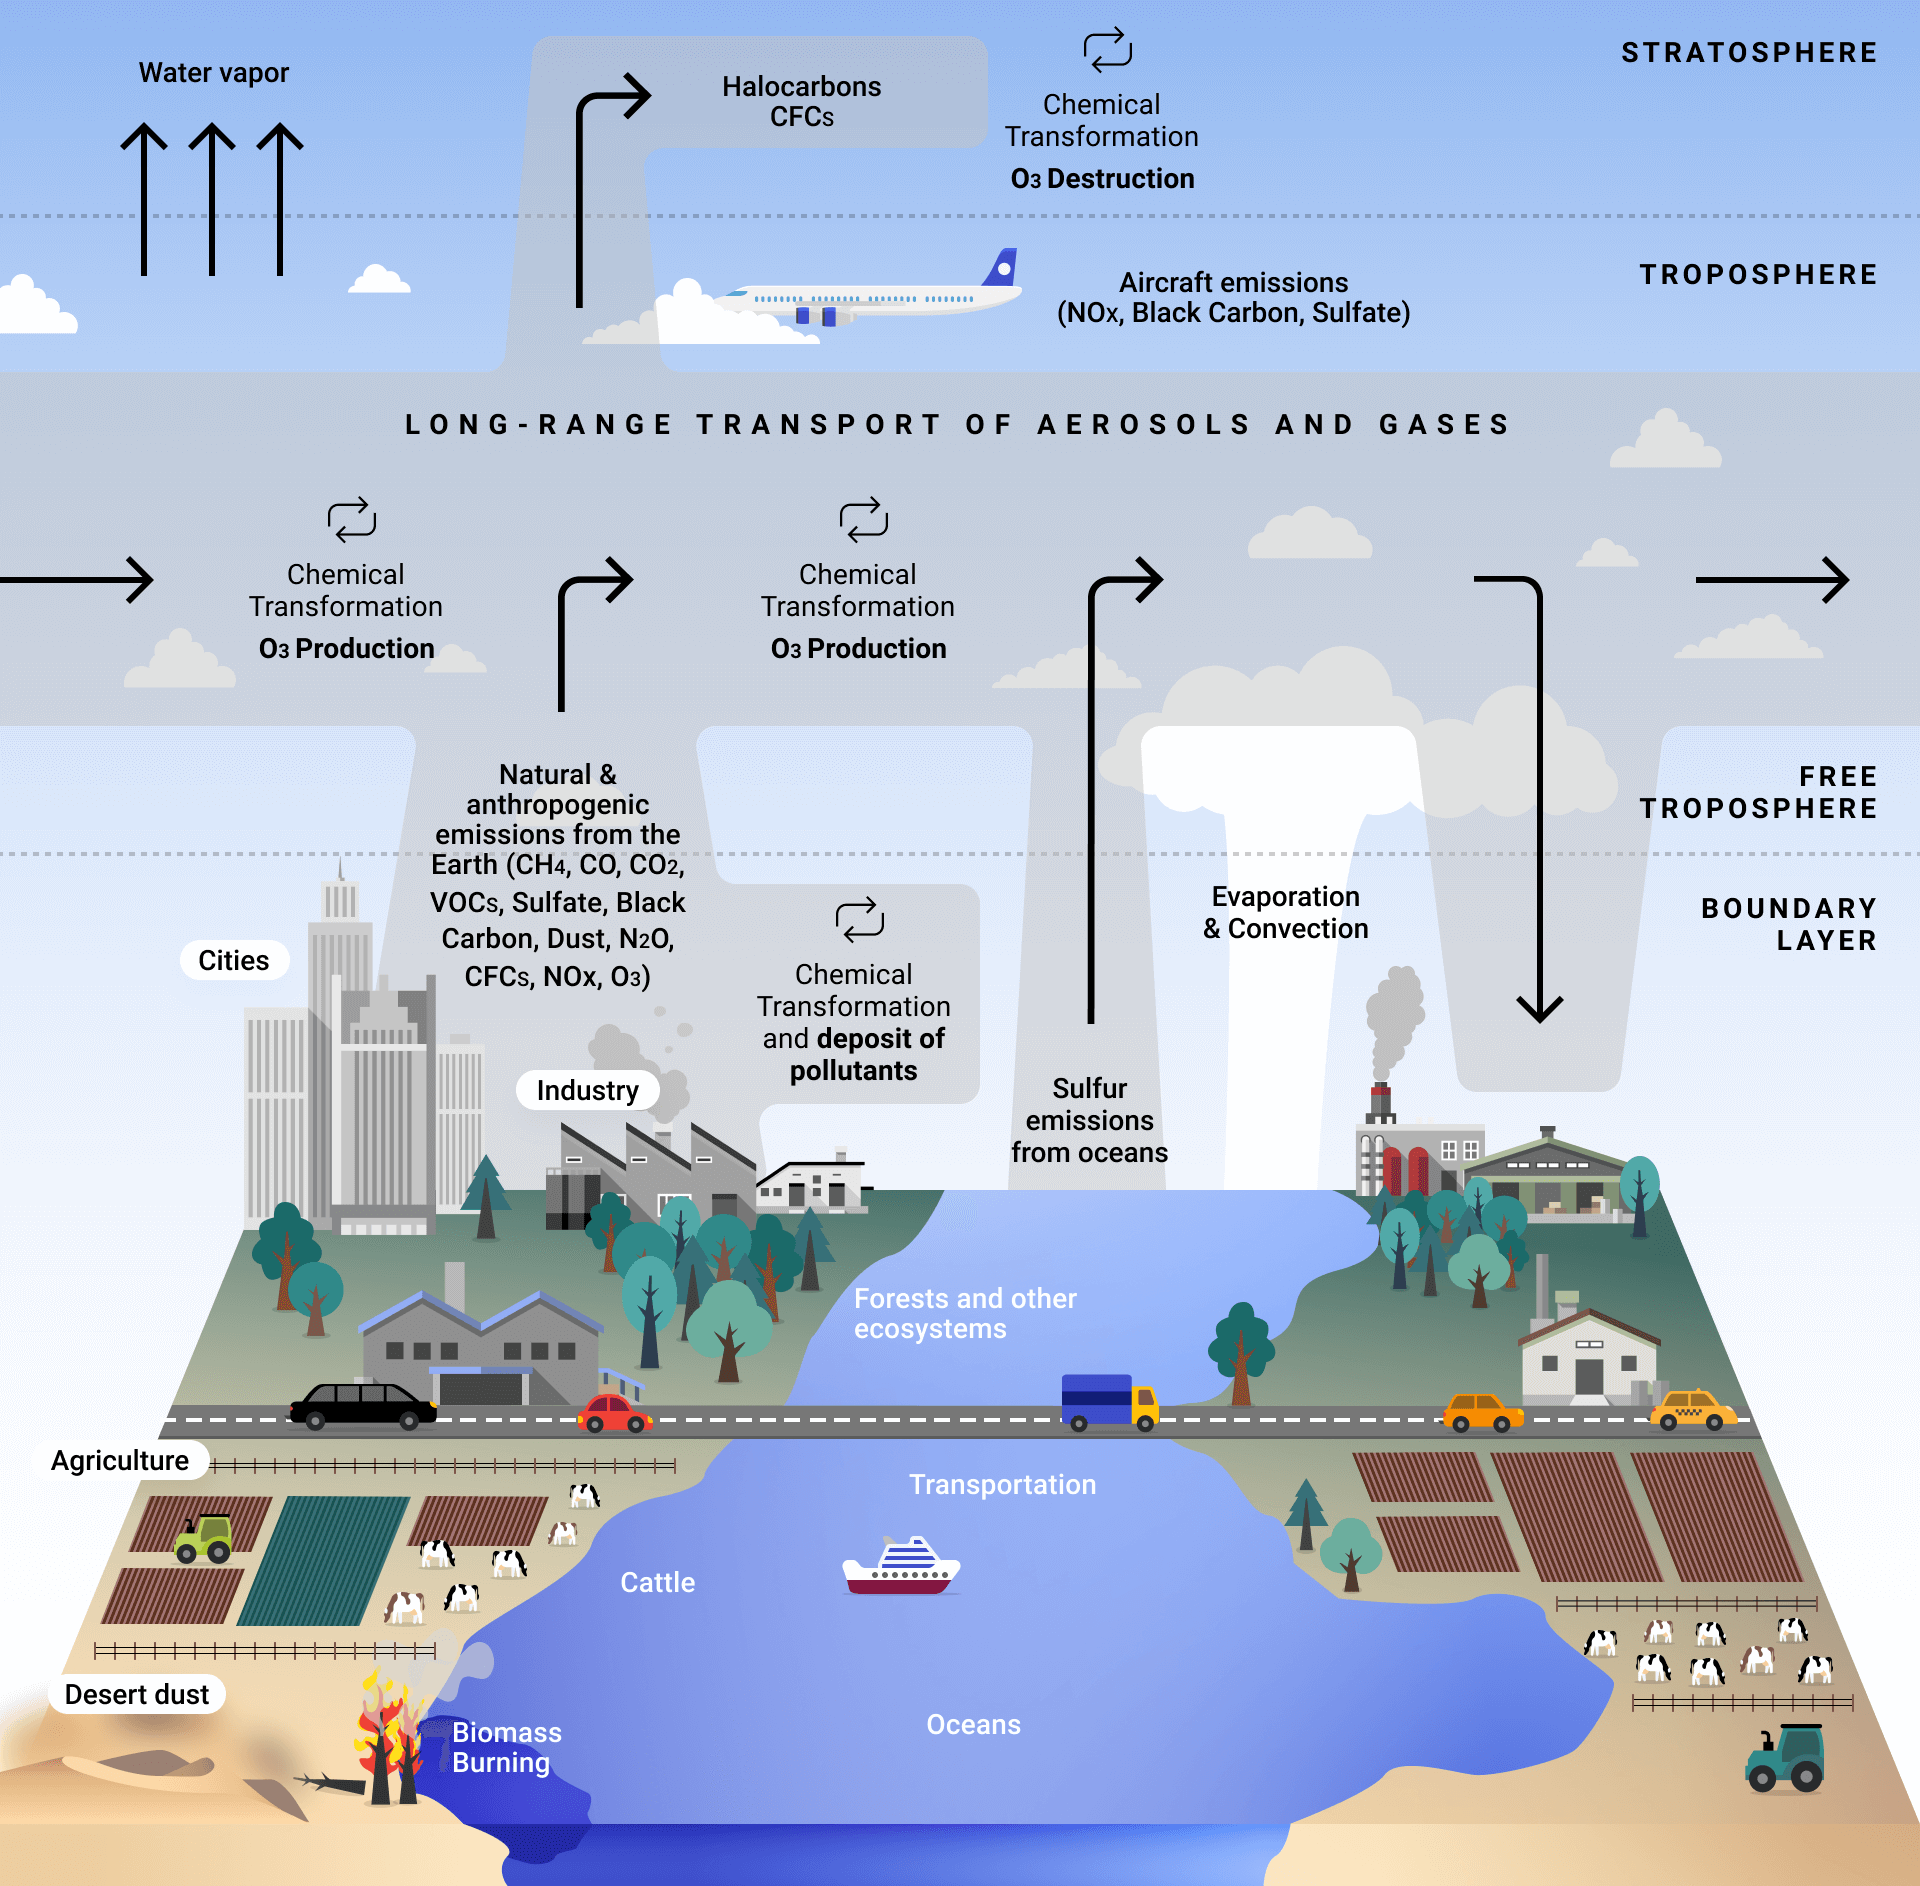
“Climate change remains the single greatest threat to the livelihoods, security and wellbeing of the peoples of the Pacific,” according to the Boe Declaration of the 18 countries at the 49th Pacific Islands Forum in September 2018. It’s not only carbon emissions like methane (CH4) and carbon dioxide (CO2) that disturb the atmosphere and threaten climate change, but also high concentrations of carbon monoxide (CO), nitrogen dioxide (NO2), sulfur dioxide (SO2), and formaldehyde (HCHO) along with various aerosol halocarbons (CFCs) that, together, have a devastating impact on the environment over time.
At SpaceKnow, we have been monitoring air pollution via the European Space Agency’s (ESA) Copernicus Sentinel-5 Precursor satellite (S5P) since its launch in October 2017, as the first of its kind to monitor air quality and composition, for a mission of seven years. We monitor, track and analyze all of these pollutants through spectral analysis and are one of the ESA’s official validation teams for the Sentinel-5P, focusing on validating the formaldehyde (HCHO) product.
The TROPOspheric Monitoring Instrument (TROPOMI) is the detection instrument (spectrometer) on board the Copernicus S5P satellite. TROPOMI works by comparing reflected light from Earth’s atmosphere with direct sunlight at various wavelengths, from infrared to ultraviolet. It uses diffraction gratings to split this light, allowing it to sift out the spectral fingerprints of its target trace gases.
More about Copernicus: Sentinel-5P
Forty-ninth Pacific Islands Forum full release
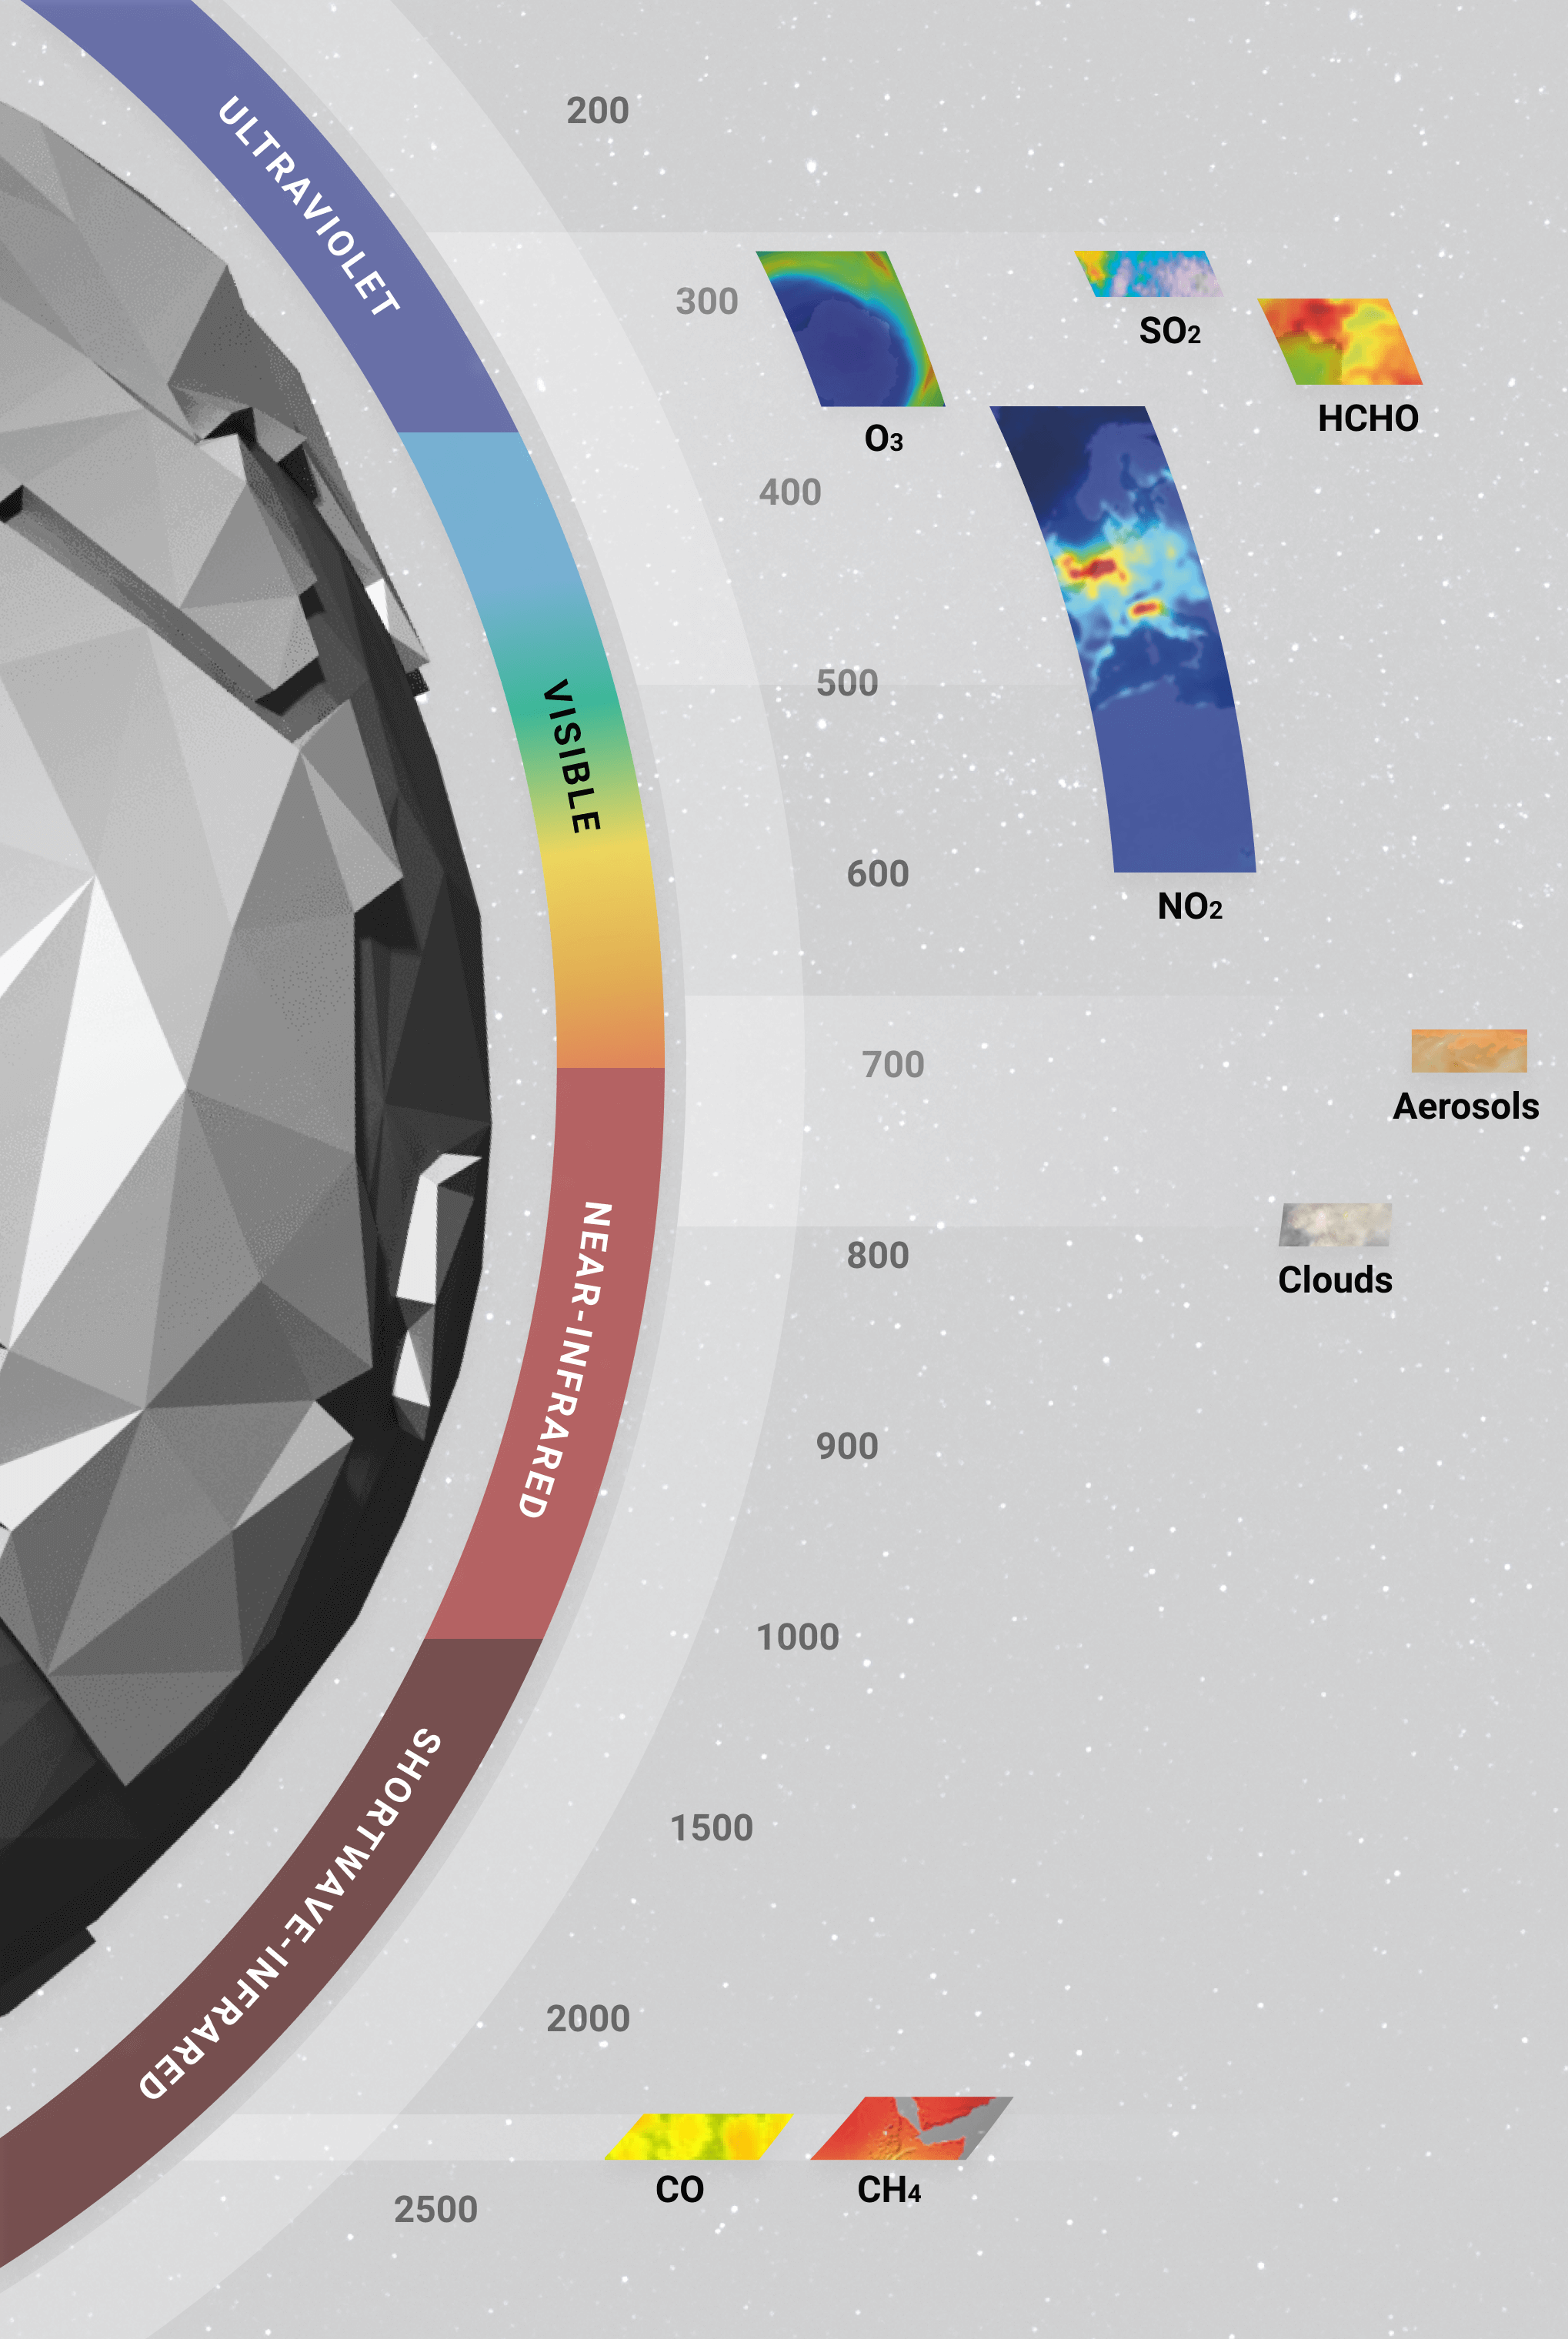
With TROPOMI, SpaceKnow has access to high-resolution data, measuring six atmospheric trace gases. This allows us to measure air quality, pollution from urban and industrial sources, gas flares and volcanic plumes. We can also measure and track changes to the Ozone Layer (O3) as well as aerosol dispersion and cloud cover – all on a global and daily basis. Over time, this produces a visible signal, allowing us and our customers to monitor the state of the atmosphere with respect to the environmental gases.
Specific concentrations of these trace gases are indicative of the following activities:
- CO (carbon monoxide): fossil fuels, biomass burning, oxidation of CH4
- HCHO (formaldehyde): oxidation of volatile organic compounds (VOCs), vegetation, fires, traffic, and a precursor of ozone (O3)
- CH4 (methane): a greenhouse gas – 75% of which is anthropogenic
- NO2 (nitrogen dioxide): fuel combustion, biomass burning, wildfires, lightning
- O3 (ozone): important in the stratosphere, as it shields the planet from UV radiation, but dangerous in the troposphere, as it can be harmful to the biosphere
- SO2 (sulfur dioxide): an aviation threat, from volcanic ash, burning, degassing, eruptions
- Aerosols: aerosol plumes (dust outbreaks, volcanic eruption, biomass)
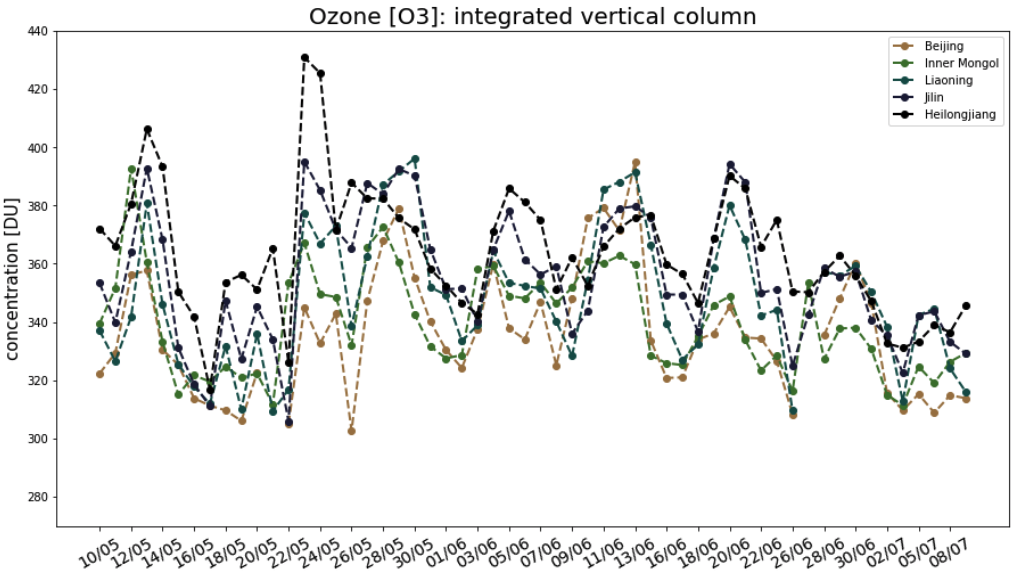
The knowledge that can be gleaned from these unprecedented data sets comprises an almost unlimited host of practical and speculative applications. We investigated the pollution in Northeastern China and their possible use of CFC-11 which has been banned since 2010. We looked into ozone levels over a two-month period from May to July 2018 and concluded that it was likely that China was continuing to use the banned substance due to the depleted ozone in the plotted areas:
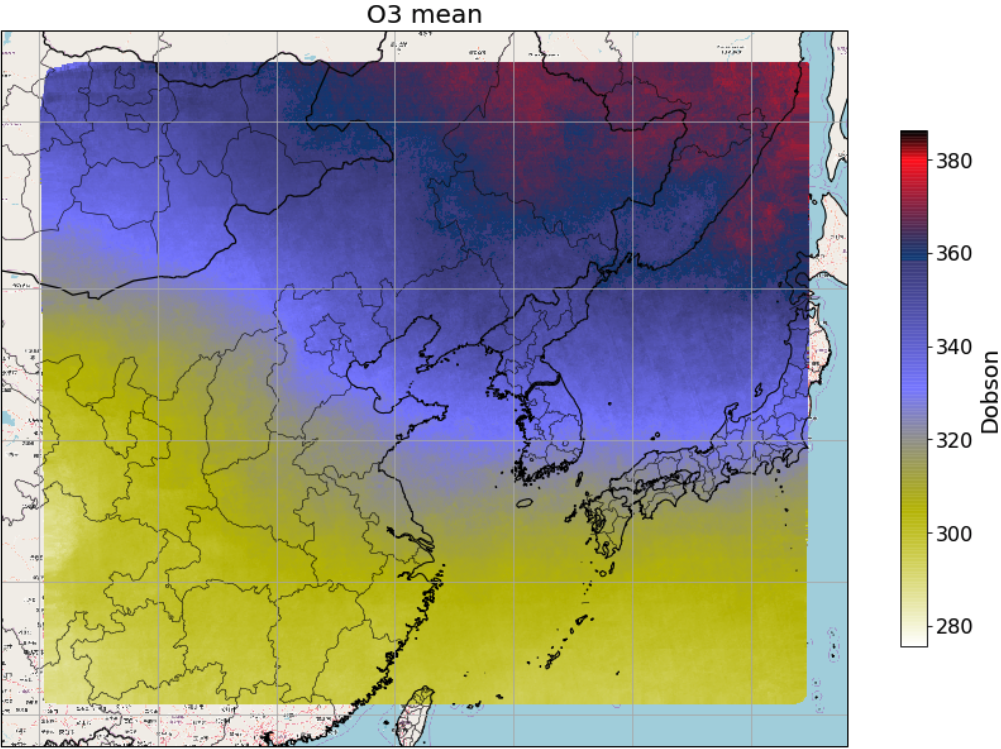
Here are the mean ozone levels for East Asia measured from 10th May to 8th July 2018. Compare industrial Northeastern China with the non-urban Russian Far East for a striking contrast:
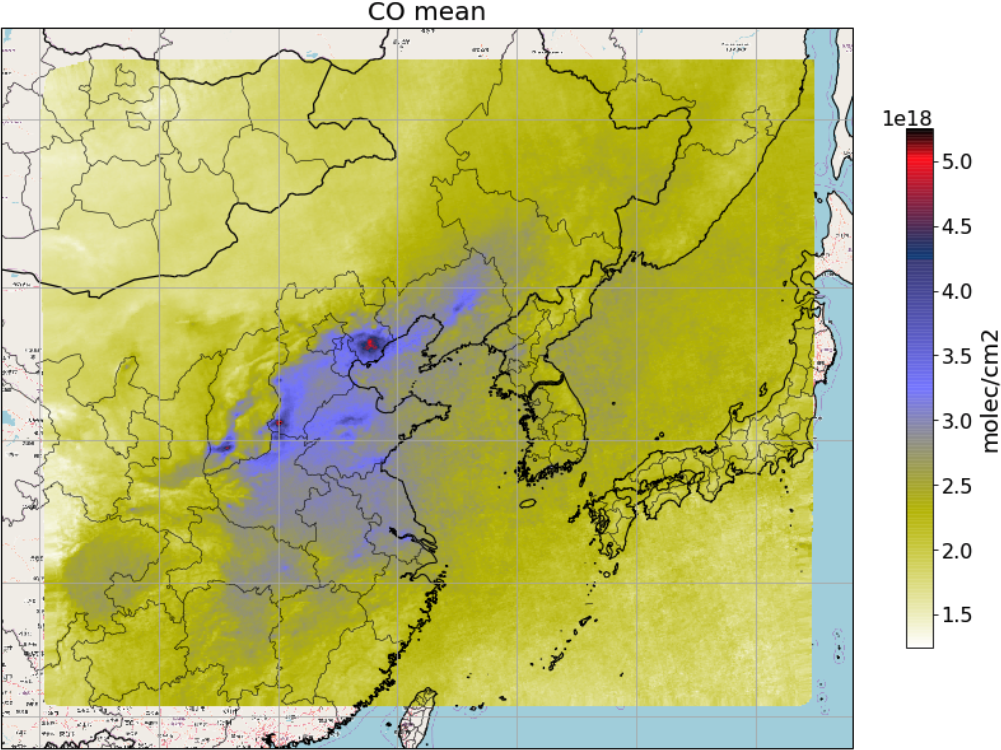
We then cross-referenced the ozone levels with concentrations of carbon monoxide (CO) for the same region and the heavily-industrialized areas became clear:
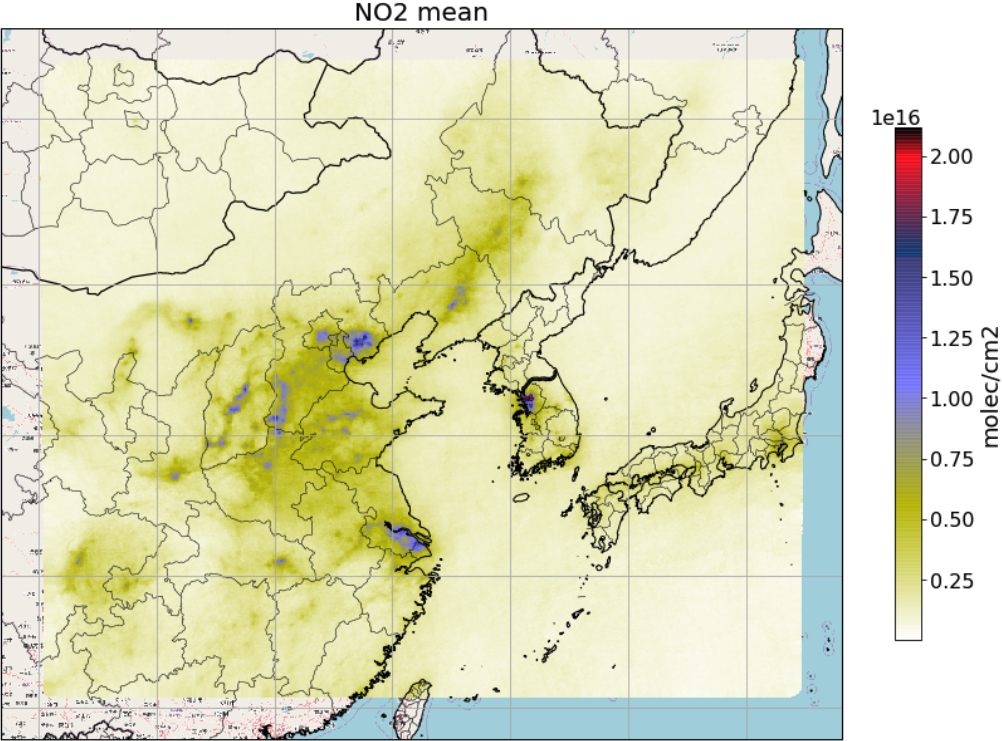
Adding a final analysis layer for nitrogen dioxide (NO2), the urban and industrial pollution appears remarkable in contrast with other regions on the map:
Next, we set our sights on the Nigerian gas flares that are lit to relieve pressure on the pumps by burning off the flammable gas. Not only do they produce massive amounts of pollution (particularly CO, SO2 and NO2), but also show up in the infrared spectrum, as they give off quite a lot of heat.
The applications for this atmospheric analysis technology are practically endless and can be customized to suit any need or query. Over time, trends can be followed and conclusions drawn. In the fight against climate change, this knowledge is power.
Published by SpaceKnow Team