Given the size and abruptness of the economic shock generated by COVID-19, there is a lot of uncertainty around current economic growth in China. Based on the official data, some suggest that China’s recovery is being fueled by government policy, specifically via their support of the construction sector.
Timely indicators of aggregate activity are necessary when forecasting is difficult. PMIs are survey-based diffusion indices which can make it hard to decipher the magnitude of actual economic change on the ground. SpaceKnow’s solution is to use satellite data to detect changes at key industrial locations. Our China Satellite Manufacturing Index (CN SMI) is an independent snapshot of overall manufacturing activity, and we released our June estimate today.
In the chart below, we break down the China SMI into specific categories ranging from distribution centers to container ports and more. Metals+Cement here represents the supply chain into fixed asset investment in China.
SpaceKnow China Satellite Manufacturing Index (CN SMI)
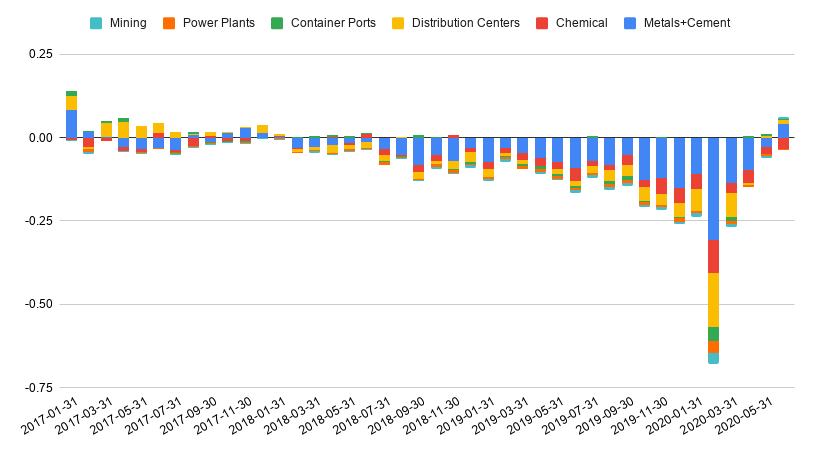
The bars represent the index level, with each category’s contribution depicted by a specific color. Metals+Cement were slowing over the past few years, in line with the underlying story of China’s moderating construction sector. Then, starting in late 2019, the pandemic accelerated the decline. Since March, the sector has shown a strong recovery, marking a local historic high in June 2020. The magnitude of swing in the Metals+Cement category is larger than the others, suggesting that the construction sector has played a large part in the turnaround of activity.
At SpaceKnow, we are creating a picture of the global economy from space. For more insights into Chinese manufacturing activity, visit our website, subscribe to our index, or reach out to us at info@spaceknow.com.
Published by Jared Laxton and Lucia Krajnikova