At SpaceKnow, we believe that industry activity can be measured using consecutive satellite images of the earth. It’s measured in the changing sizes of iron ore stockpiles at a mine, the number of finished goods stored outside in certain industries, and the traffic of trucks at a loading warehouse or a customs border. By taking consecutive high-quality images of carefully selected industrial locations, processing them with powerful change-detection algorithms, and aggregating those changes into indices, we are able to offer high-frequency insight into the output or total activity levels of industries, sectors, countries, businesses, and more.
This premise has guided the development of SpaceKnow Nowcasting Solutions, our economic data vertical, since our inception in 2014. When I joined SpaceKnow in May 2020, our research team was excited about the results of their initial experiments with SAR data, and a bit over a month later we announced the launch of our first SAR-based activity indices.
Since then, we have continued to build upon our initial work, culminating in the subject of this article: SpaceKnow Insights, an interactive data platform that gives our customers a front-row seat to what’s happening in every industry observable from space, every day.
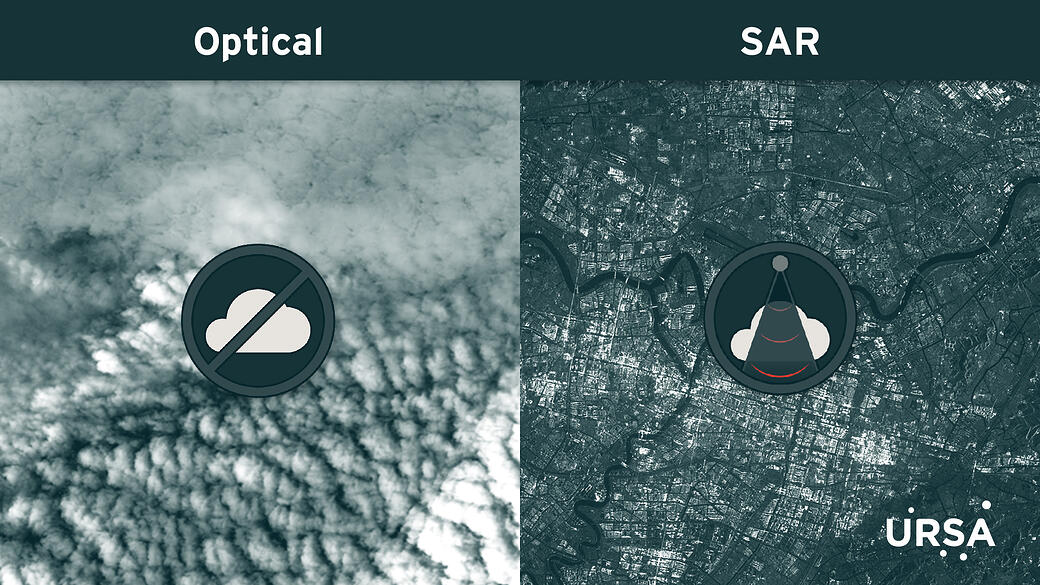
What’s so special about SAR data? In a word; consistency. SAR, or Synthetic Aperture Radar, is unaffected by weather, time of day, or cloud cover. Almost every time a SAR satellite snaps a photo, the data produced is usable – a stark contrast to optical imagery, which relies on light from the sun and is often rendered unusable by clouds and other atmospheric conditions. For a deeper dive into SAR imagery, check out this page from our friends at ICEYE.
We quickly realized that our first SAR-based products, which were released 3 times per month, were not being delivered with sufficient frequency for the majority of our clients. With COVID lockdowns going into and out of effect, countries and industries closing and re-opening, confusing and cluttered news cycles, the real need became clear: high-frequency data on a country’s activity levels, disaggregated by industry. Our clients needed to know what was actually happening on the ground – today, tomorrow, and every day going forward.
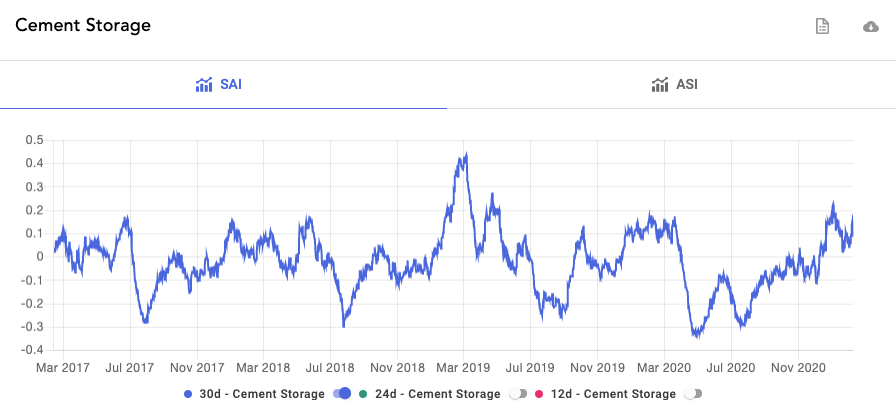
This led to the release of SpaceKnow Industry Radar (SKIR) in September 2020: a suite of daily indices of industry activity by country. SKIR features two types of indices: the Satellite Activity Index (SAI), and the Activity Structure Index (ASI). The SAI is a pure index of activity detected on the ground in a country’s industry. It can be used to forecast a certain industry’s output, as it comes out far more often than government and survey data. A typical chart looks like this:
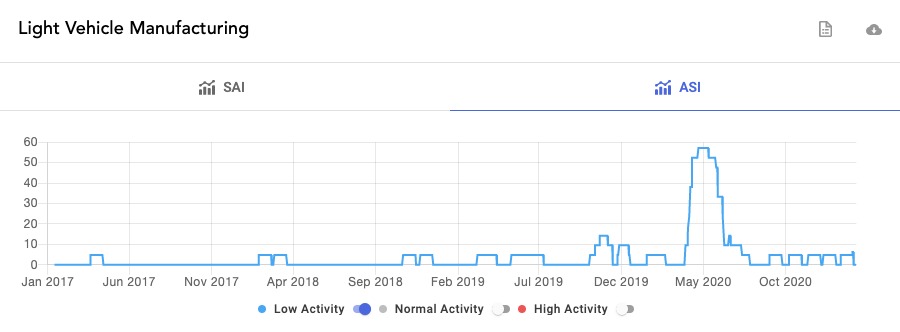
The ASI takes the same locations used for the SAI and buckets them into 3 groups – high activity, low activity, and normal activity. It is extremely useful for catching inflection points, for example, in the event of a lockdown or reopening. Here is the ASI for light vehicle manufacturing in India.
When used in tandem, these indices provide powerful insights. This and this article show how we used the SAI and ASI to analyze activity in China’s automotive industry.
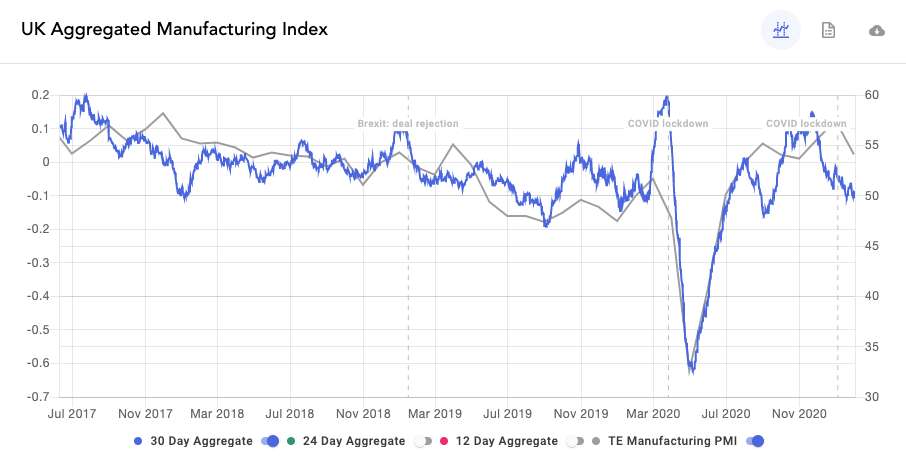
Our latest release, aggregated sector activity indices, brings together all the lessons, improvements, and work we’ve done until now. Using the same high-quality data, our carefully curated locations database, and cutting edge change detection algorithms, we’ve released daily indicators on the Manufacturing, Mining, Trade, and Construction sectors in a variety of countries with high correlations to macroeconomic indicators. The example below is our Manufacturing Satellite Activity Index in the UK against the PMI:
We then found ourselves in somewhat of a predicament. We had a set of great products – industry-specific indices from SKIR, macroeconomic indicators in the form of our sector aggregates, regional pollution indices, as well as the research insights we were finding in our data. However, there was still one big unanswered question: what to do with them?
The answer came from a call with one of our customers. We had explained our premise, walked them through a bit of our product history, current offerings, just as I’ve done in this article, and by the end of the call, their interest had been piqued and they were eager to get their hands on the data. That’s when they asked us if we had some kind of interactive platform where all this data was visible.
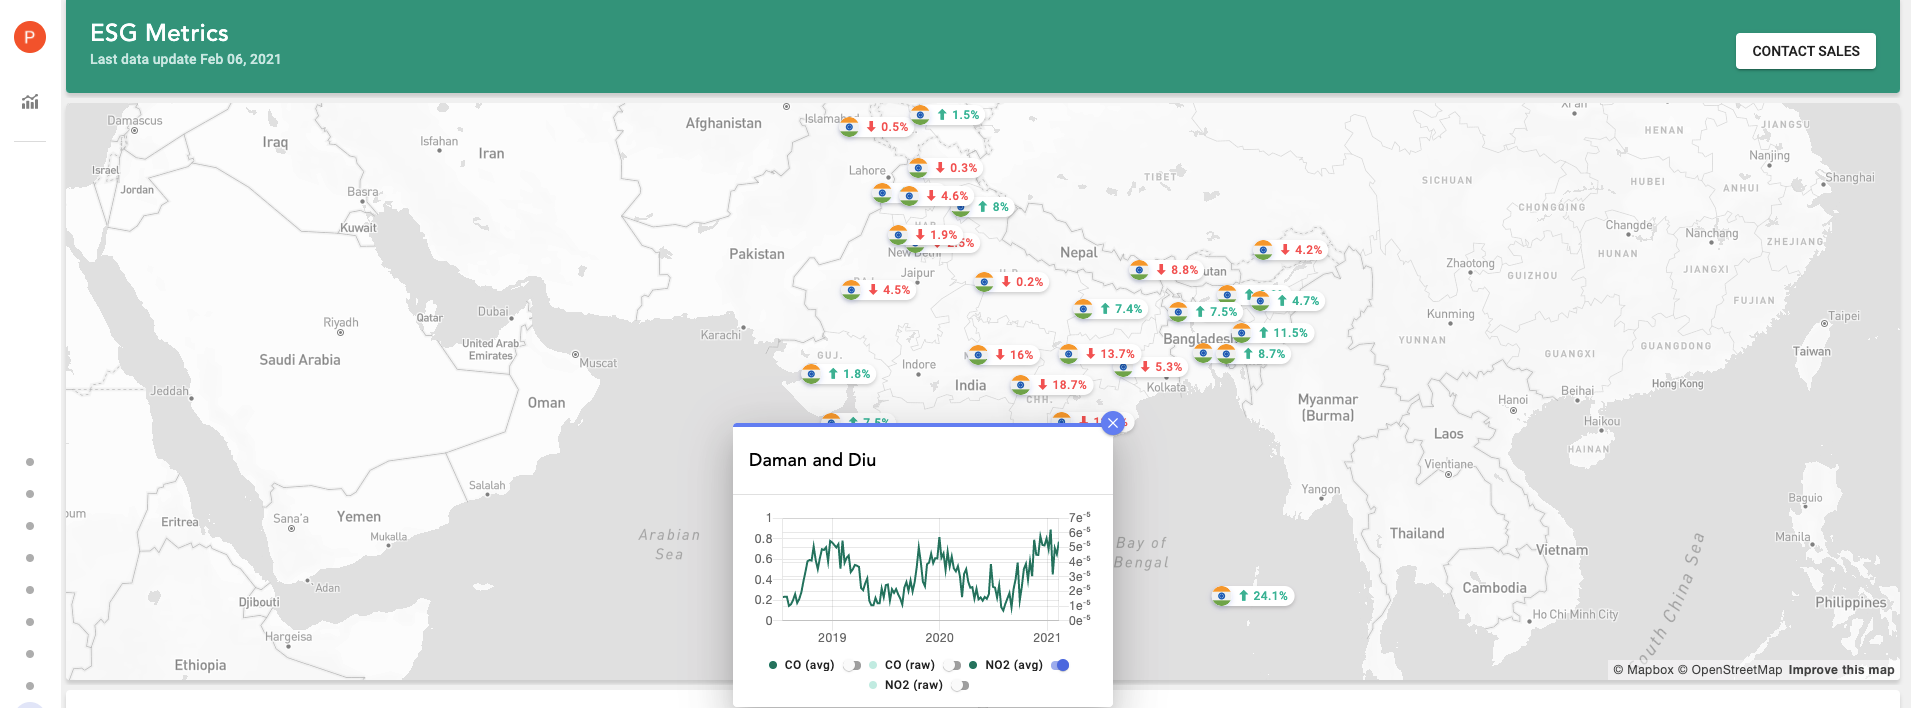
This was the exact idea we needed to bring all these pieces together. A platform where users could monitor a country’s sector activity, industry activity, and regional pollution levels in near-real time. A platform where our data could be charted against benchmarks, so users could see lockdowns or trends before the market had caught on. A platform where we could share our insights with our clients. A platform we could continuously enhance as we develop more granular indices, expand our coverage, and think of creative ways to add more value (such as by integrating imagery analytics).
That’s what we’ve built with SpaceKnow Insights: a first-of-its-kind data platform. It gives our customers a front-row seat to what’s happening in every industry observable from space, every day – and that’s just right now. Much more is yet to come.
If you would like to set up a demo, hear more about our products, or ask us a question, please get started with us at www.spaceknow.com, email info@spaceknow.com, or contact me personally at czernek@spaceknow.com.