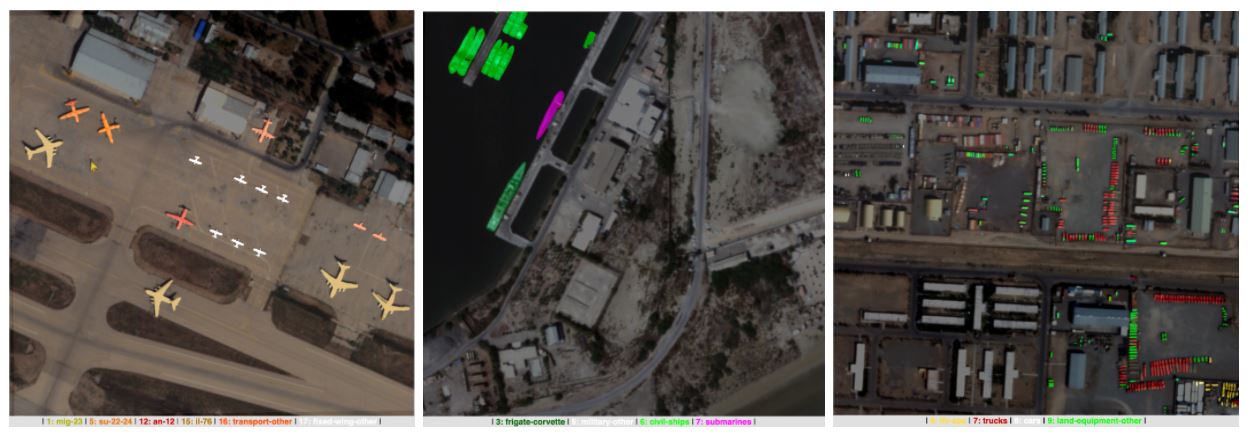
At SpaceKnow, we train machines to analyze satellite images to generate insights and provide actionable intelligence in a fully automated fashion, without a human-in-the-loop. We implement on-the-fly object detection and semantic segmentation algorithms with global applicability. Both supervised and unsupervised state-of-the-art machine learning algorithms and deep neural networks are applied to high and medium resolution satellite imagery and, with the help of our fully-automated and dynamically scaled cloud clusters, SpaceKnow is able to perform on-demand, large-scale, and unconstrained object detection and semantic segmentation tasks anywhere satellite imagery is available (see Figure 1 and 2).
To provide our customers with a huge variety of analytical capabilities, we are continuously expanding our pool of object types, features or materials that we are able to identify, extract and serve to our customers via user friendly interface or APIs. With this growing pool of algorithms (currently 50+), and numerous new satellites being launched into the sky, we usually hear the same questions: Which satellite imagery do you support? What is the performance of your algorithms? Can you run your algorithms on imagery that I have access to?

The aim of this blog post is to explain how we answer these questions and what we actually have to do to scale up and strengthen our capabilities with all the new emerging satellites and satellite imagery providers coming to the market.
Satellite images are NOT just pictures
Being successful in delivering analytics of satellite imagery means combining the domains of classical remote sensing, deep learning, computer vision and signal processing. For someone with a computer vision background, this means adding one more dimension when thinking about the data – beside the spatial and temporal resolution, one must consider the spectral resolution as well.
Analyzing satellite imagery is not only about extracting shapes and features in the visible part of the spectrum, but also utilizing the near-infrared bands, short-wave infrared, and others.
Satellite imagery brings many challenges to the table: necessity of atmospheric and terrain based corrections, influence of weather and other environmental effects, missing and erroneous pixels or even the off-nadir viewing angle that sometimes alters the context and hides the object of interest behind obstacles. All of this creates a huge variance in the data, not mentioning the variability of the environment as such.
To successfully capture this variance and prepare your models to perform sufficiently well, the obvious first step is to capture such variance in your training, validation, and testing datasets. Developing and creating such complex datasets not only requires you to download, properly select and annotate the data, but ideally do so for each satellite provider or even satellite that you want to ingest to ensure good performance.
This of course means an immense amount of work, time, and money that go into creating these datasets and then performing experiments to find your best performing model.
Using the full spectrum!
At SpaceKnow we utilize state-of-the-art techniques such as low-shot learning, fine tuning, data augmentation, and sample filtering to deliver fast prototypes and to mitigate the necessity of creating large datasets. Combining all of these techniques in a clever way and applying them to the visible part of the spectrum allows us to create provider agnostic models, i.e. robust models compatible with data coming from different providers.
The first step to success is to focus on the robustness to the changes in spatial resolution. There are physical limitations; with decreased spatial resolution observability of small objects decreases as well. By focusing our research and development effort on this issue, we are able to achieve high performance in recognition of various types of objects in the maritime, land vehicles and aircraft domains, applicable over various high resolution optical imagery providers such as SkySat (Planet), WorldView (Maxar), Airbus and others (see Figure 2).
However, only using the visible part of the spectrum can be limiting especially when detecting various types of material (such as coal, lithium, wood) or when performing heat signature analysis of industrial locations. Using the full spectral range, i.e. all of the available bands, brings more information about the observable content, although it increases the dimensionality of the data, and the curse of dimensionality still applies.
How can we easily utilize the rich multi-spectral information and train a deep neural network based model that will perform well? Our solution lies in using the normalized difference based indices, such as NDVI, EVI, MSAVI2, etc., that have been part of the remote sensing field for decades. Transforming the input imagery this way is a well known and easy procedure. At SpaceKnow we have developed our own proprietary transformations that use the spectral bands that carry the portion of the spectra that has a strong response to the object or material of interest. These transformations can be easily calibrated for images coming from various sources with the spatial resolution rescaled or augmented as needed.
How good are we?
In order to develop the best performing models, we execute a battery of experiments in our proprietary framework. In principle, they work like LEGO pieces. Our framework allows us to easily construct experimental pipelines from modular building blocks; beginning with dataset creation, data preprocessing, training, predicting, evaluating, and visualizing, even including automatically generated reports which indicate potential improvements.
Once an experiment is finished, we decide whether the tested model, with given settings and parameters, generates a “best model” candidate or even a “deployment” candidate that runs in production. For each experiment we keep our standardized metrics documented as part of the report. All visualizations are selected in such a way that we can directly see the performance on the testing data as well as the data samples with the most significant false positives and false negatives.
We strictly divide our data into training, validation, and testing datasets; calling the testing dataset a benchmark. Such a benchmark is, intentionally, a very challenging dataset. It is drawn from the specific data distribution that should cover the high variance, in order to reflect the generalization capability as truly as possible. A low score on the benchmark does not necessarily mean it is “not good enough” for the customer. We iteratively evaluate our best models, identify fail cases, and extend the benchmarks to include the fail cases (e.g. hard to detect dark vehicles hidden in shadows) and we always compare the performance in the new iterations with the performance of the previous “best model”.
The vast majority of our deep learning models perform semantic segmentation, meaning we deliver decisions on a “per pixel” basis, assigning each pixel a probability value belonging to a given class. We further process individual segments in order to provide a vectorized output for the customer.
Performing semantic segmentation instead of the more common object detection has several advantages: we can measure segment properties such as length, area, orientation, compactness, or eccentricity, and we do not have to deal with multiple object detection filtering. On the other hand, in some cases, small segments might not be clearly separable (e.g. vehicles parked next to each other) and the performance of object counting can then be slightly limited. Our primary metrics for evaluation are the pixel-wise segmentation metrics, such Precision, Recall, Intersection over Union, F-score and Confusion Matrix. We compute these metrics per class, and aggregate them together in multi-class algorithms to get a more general view of the algorithm performance.
Conclusion
At SpaceKnow we consider our datasets and the way we extract information from satellite measurements equally important to our architectures of deep neural networks. Adhering to the principles described in this post, we construct a rich time series of analytical insights by applying our provider agnostic models to multiple images coming from multiple providers.
For more information, please visit us at www.spaceknow.com, or feel free to contact us at info@spaceknow.com.
Written by Michal Reinstein on behalf of SpaceKnow.